Tail-Detection
| Sample size n | 154 |
| Ahmad AU² (optimal) | 0.121 |
| p-Value for choosen parameter set | 0.698 (calculated with 500 MC steps) |
| Start of the Tail at datapoint k* | 34 |
| Tail weight k*/n | 22.1% |
| Threshold u | 107.58 |
Goodness-of-Fit Tests
| Cramér-von Mises W² (p-Value) | 0.037 (0.78) |
| Anderson-Darling A² (p-Value) | 0.307 (0.678) |
Fit Values
Generalized Pareto Distribution with location parameter zero
| ξ | σ |
|---|---|
| -0.09 | 58.506 |
Risk assessment
| Quantile | Value-at-Risk |
|---|---|
| 0.95 | 188.92 |
| 0.97 | 214.48 |
| 0.99 | 265.62 |
| 0.999 | 357.75 |
| Quantile | Conditional-Value-at-Risk |
|---|---|
| 0.95 | 227.01 |
| 0.97 | 250.46 |
| 0.99 | 297.39 |
| 0.999 | 381.92 |
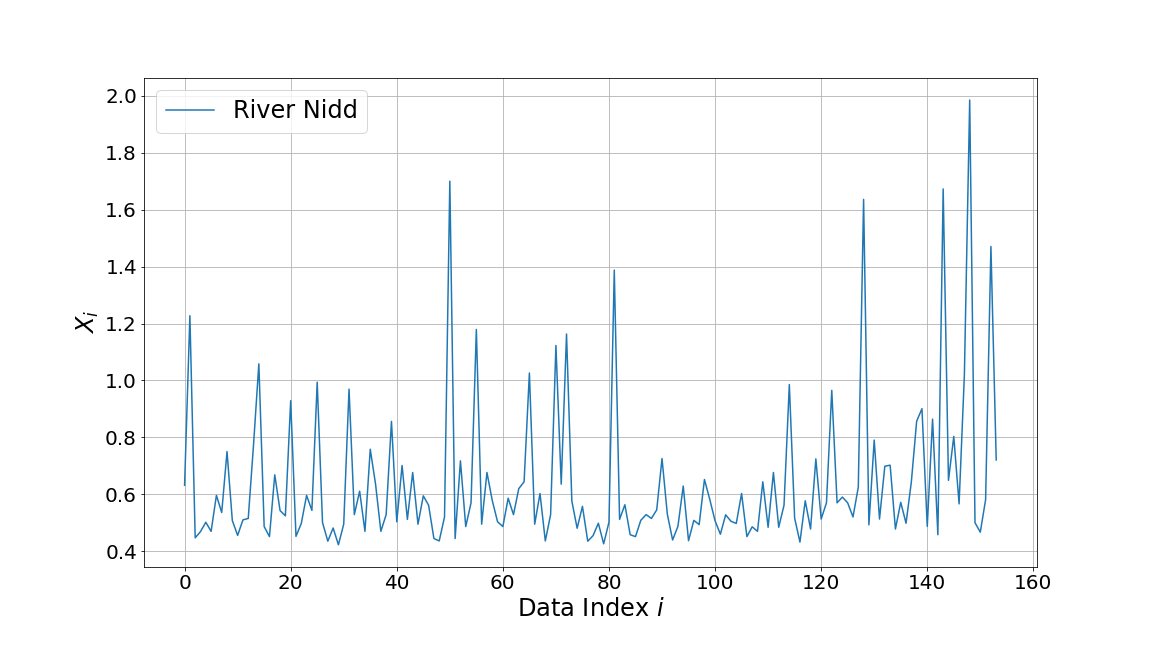
Input data
Tail-Detection and Test-Statistics

Empirical Distribution
